And what are they spending it on?
According to a Gartner CMO Spend Survey released in late 2016, marketing budgets appear to be climbing consistently. In fact, according to the CMO survey, budget increases have been steady for the past 3 years. The survey revealed 2016 budgets to be at 12% of company revenue. Says who? Over 300 marketing leaders throughout the United States and the United Kingdom.
This data leaves business owners and marketers with a few questions. Is that enough? Sometimes. Is it too much? Probably not. But, it’s hard to talk about how much businesses should spend on marketing if we don’t first identify trends across different industries, as well how much revenue your business has to work within the first place.
Marketing Budgets by Industry
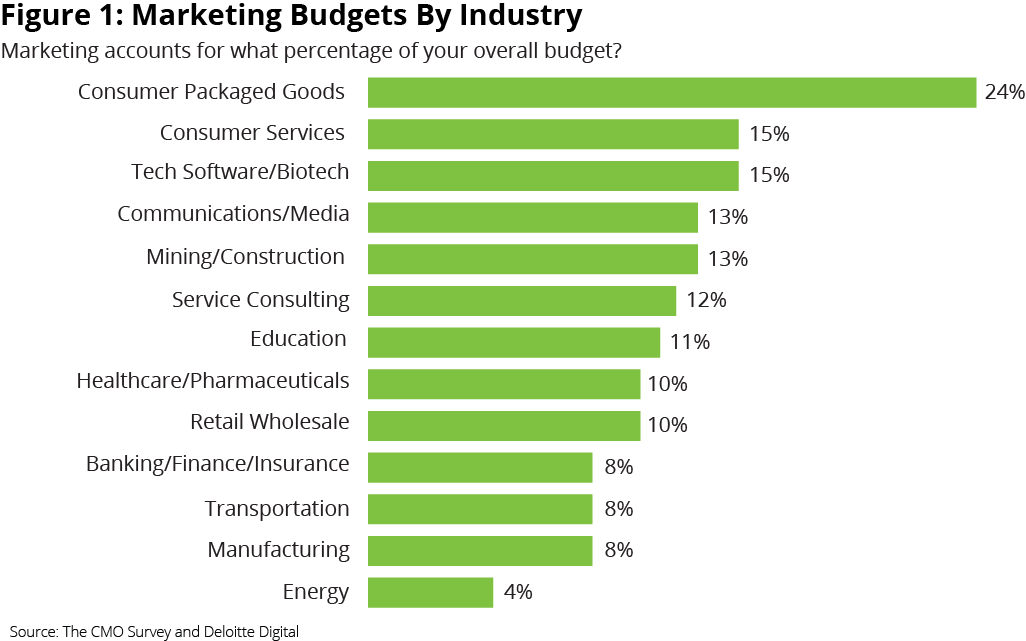
When you break businesses down into different market segments, the numbers start to fluctuate a bit from the average. The following chart from Gartner’s 2016 CMO Spend Survey gives a much more detailed breakdown of marketing budgets by industry.

As you can see, consumer packaged goods are spending by far the most out of the above 13 industries, while energy companies are spending the least. All of the industries in between are hovering pretty close to the average of 12%. Marketing budgets appear to fluctuate significantly by industry.
Marketing Budgets by Revenue
With the average at 12%, survey results show that companies with more than $5 billion in revenue are spending 13% of their revenue on their marketing budgets. On the lower end of the scale, companies with $250 million to $500 million in revenue spend closer to 10% of their annual revenue on marketing. So marketing spend does appear to be relative to annual revenue as well.
What are they Spending it on?
So, what are businesses spending all of that revenue on? Websites, digital commerce, social mobile and email are among the top areas where marketers are spending their budgets. 
1. Websites and Digital Commerce
The 2016-2017 CMO survey showed that marketers spent 9% of their budgets on websites, which was higher than all of the other categories surveyed. The next largest spend of those surveyed was digital commerce, with marketers spending 8% of their budget on this aspect of marketing. Specifically, B2C marketers spend more than B2B marketers on digital commerce, with B2C at 9%, vs. B2B at 7%.
2. Social, Mobile and Email
Another recent study, by GetResponse, indicated that social media, mobile and email marketing are a main focus for many small businesses in 2017. Of those surveyed, 59% indicated they would be increasing marketing efforts on Facebook, LinkedIn and Twitter specifically, while 50% highlighted mobile marketing, and 42% planned to focus on email marketing.
3. What About Content Marketing?
According to the Content Marketing Institute, “Content marketing has become an almost universal tactic, with almost 90% of companies using it in 2016, and even more utilizing it in 2017. While a MarketingProfs report indicates that businesses spending 39% or more of their marketing budgets will be more successful, the average marketer spends only 29% of their marketing budget on content marketing.
4. Online Video Marketing
Statistics gathered by Hubspot indicate that video marketing is only going to grow in the years to come. In fact, “video is projected to claim more than 80% of all web traffic by 2019.”
And, did you know that adding a video to your marketing emails can effectively increase click-through rates by 200-300%? Right now, 87% of online marketers are using video marketing as part of their overall digital marketing efforts, and it isn’t showing signs of slowing down any time soon.
What Does the Future Hold?
Forrester research estimates that “US digital marketing spend will near $120 billion by 2021.” Among top areas in digital marketing are paid search, social media advertising, display advertising, email marketing and online video advertising, which is estimated to reach 46% of all advertising by 2021.
Developing a Marketing Budget
Not sure where to start when it comes to developing a marketing budget for your business? Consider the statistics we’ve provided you with, and compare the size of your business and industry to the numbers above. That should give you a great place to start. Need help putting a budget together? SMILE can help. To get started, contact us today!


